METLOG by agCOMMANDER is a simple application that will download data from weather stations for analysis.
Daily minimum and maximum temperatures and humidities and are stored as are daily rainfall and evaporation totals (if available).
A large number of charts and tabular reports can be generated from those stored values.
In addition, weather data (and soil moisture probe, dendrometer and other sensor data if available) can be used to generate charts for any time interval from the current day up to 1 year.
MetLog currently interfaces with the following logger types for both Daily Weather Records and all associated reports and for the “All Sensors” charting module:
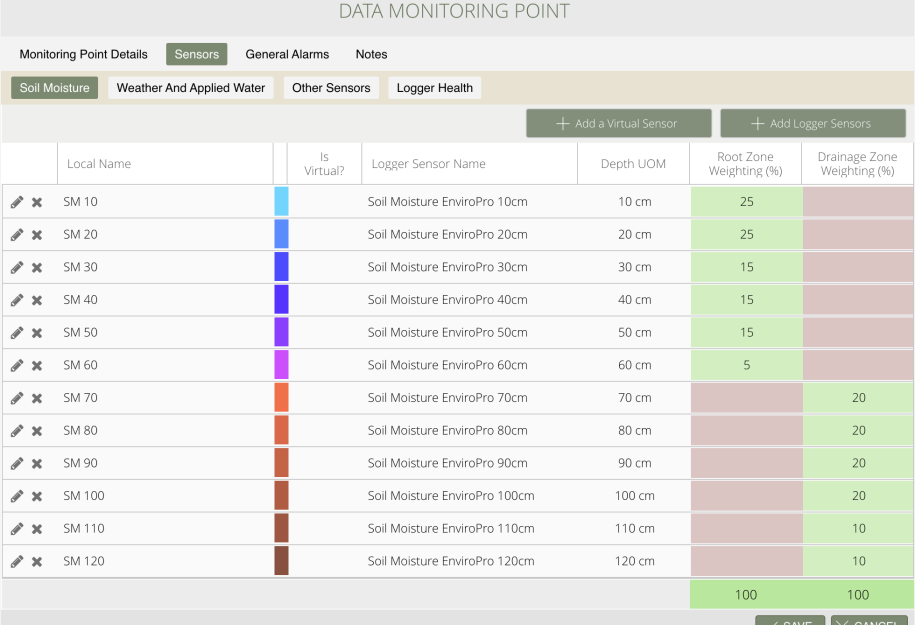
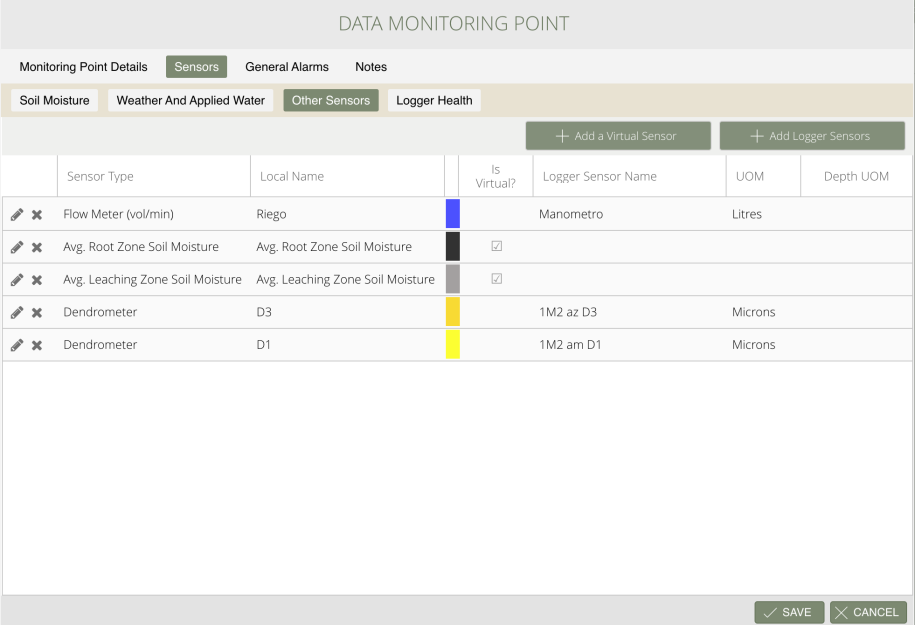
Below is a screenshot of the “All Sensors” charting system. In this situation there is a soil moisture probe with 12 sensors plus a weather station and 2 dendrometers and an irrigation flow meter.
Set up irrigation monitoring levels and they will be displayed as shaded color background areas on the chart :

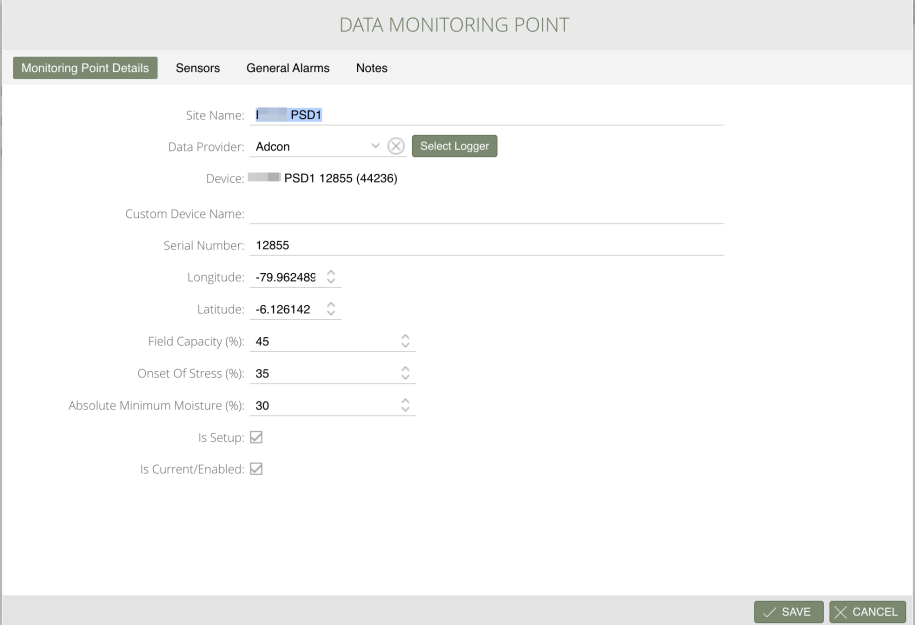
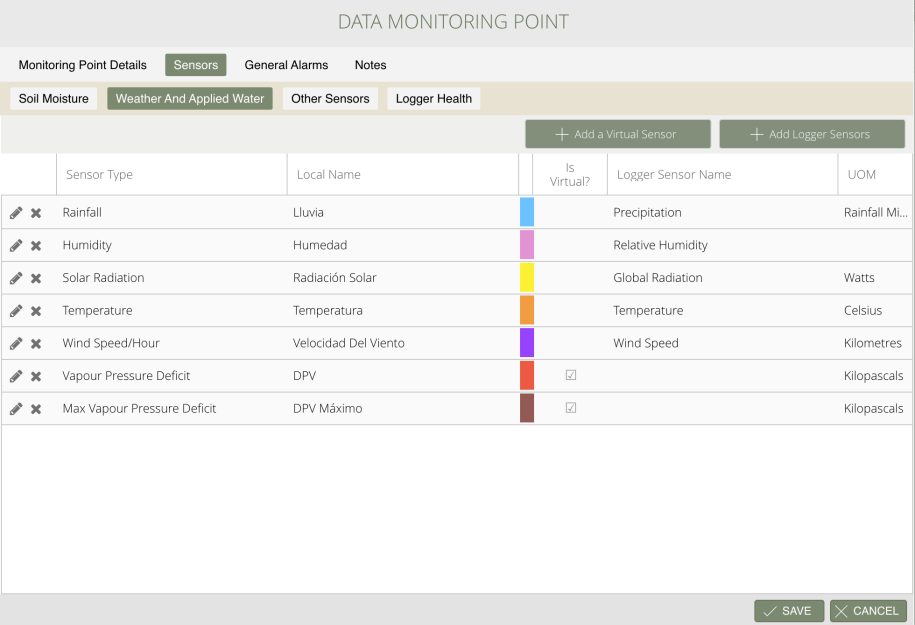
Data loggers located at Monitoring Points (that is what we call the location of the logger) are set up using the form shown below. Any sensors, weather or other sensor types, are added on the “Sensors” tab.
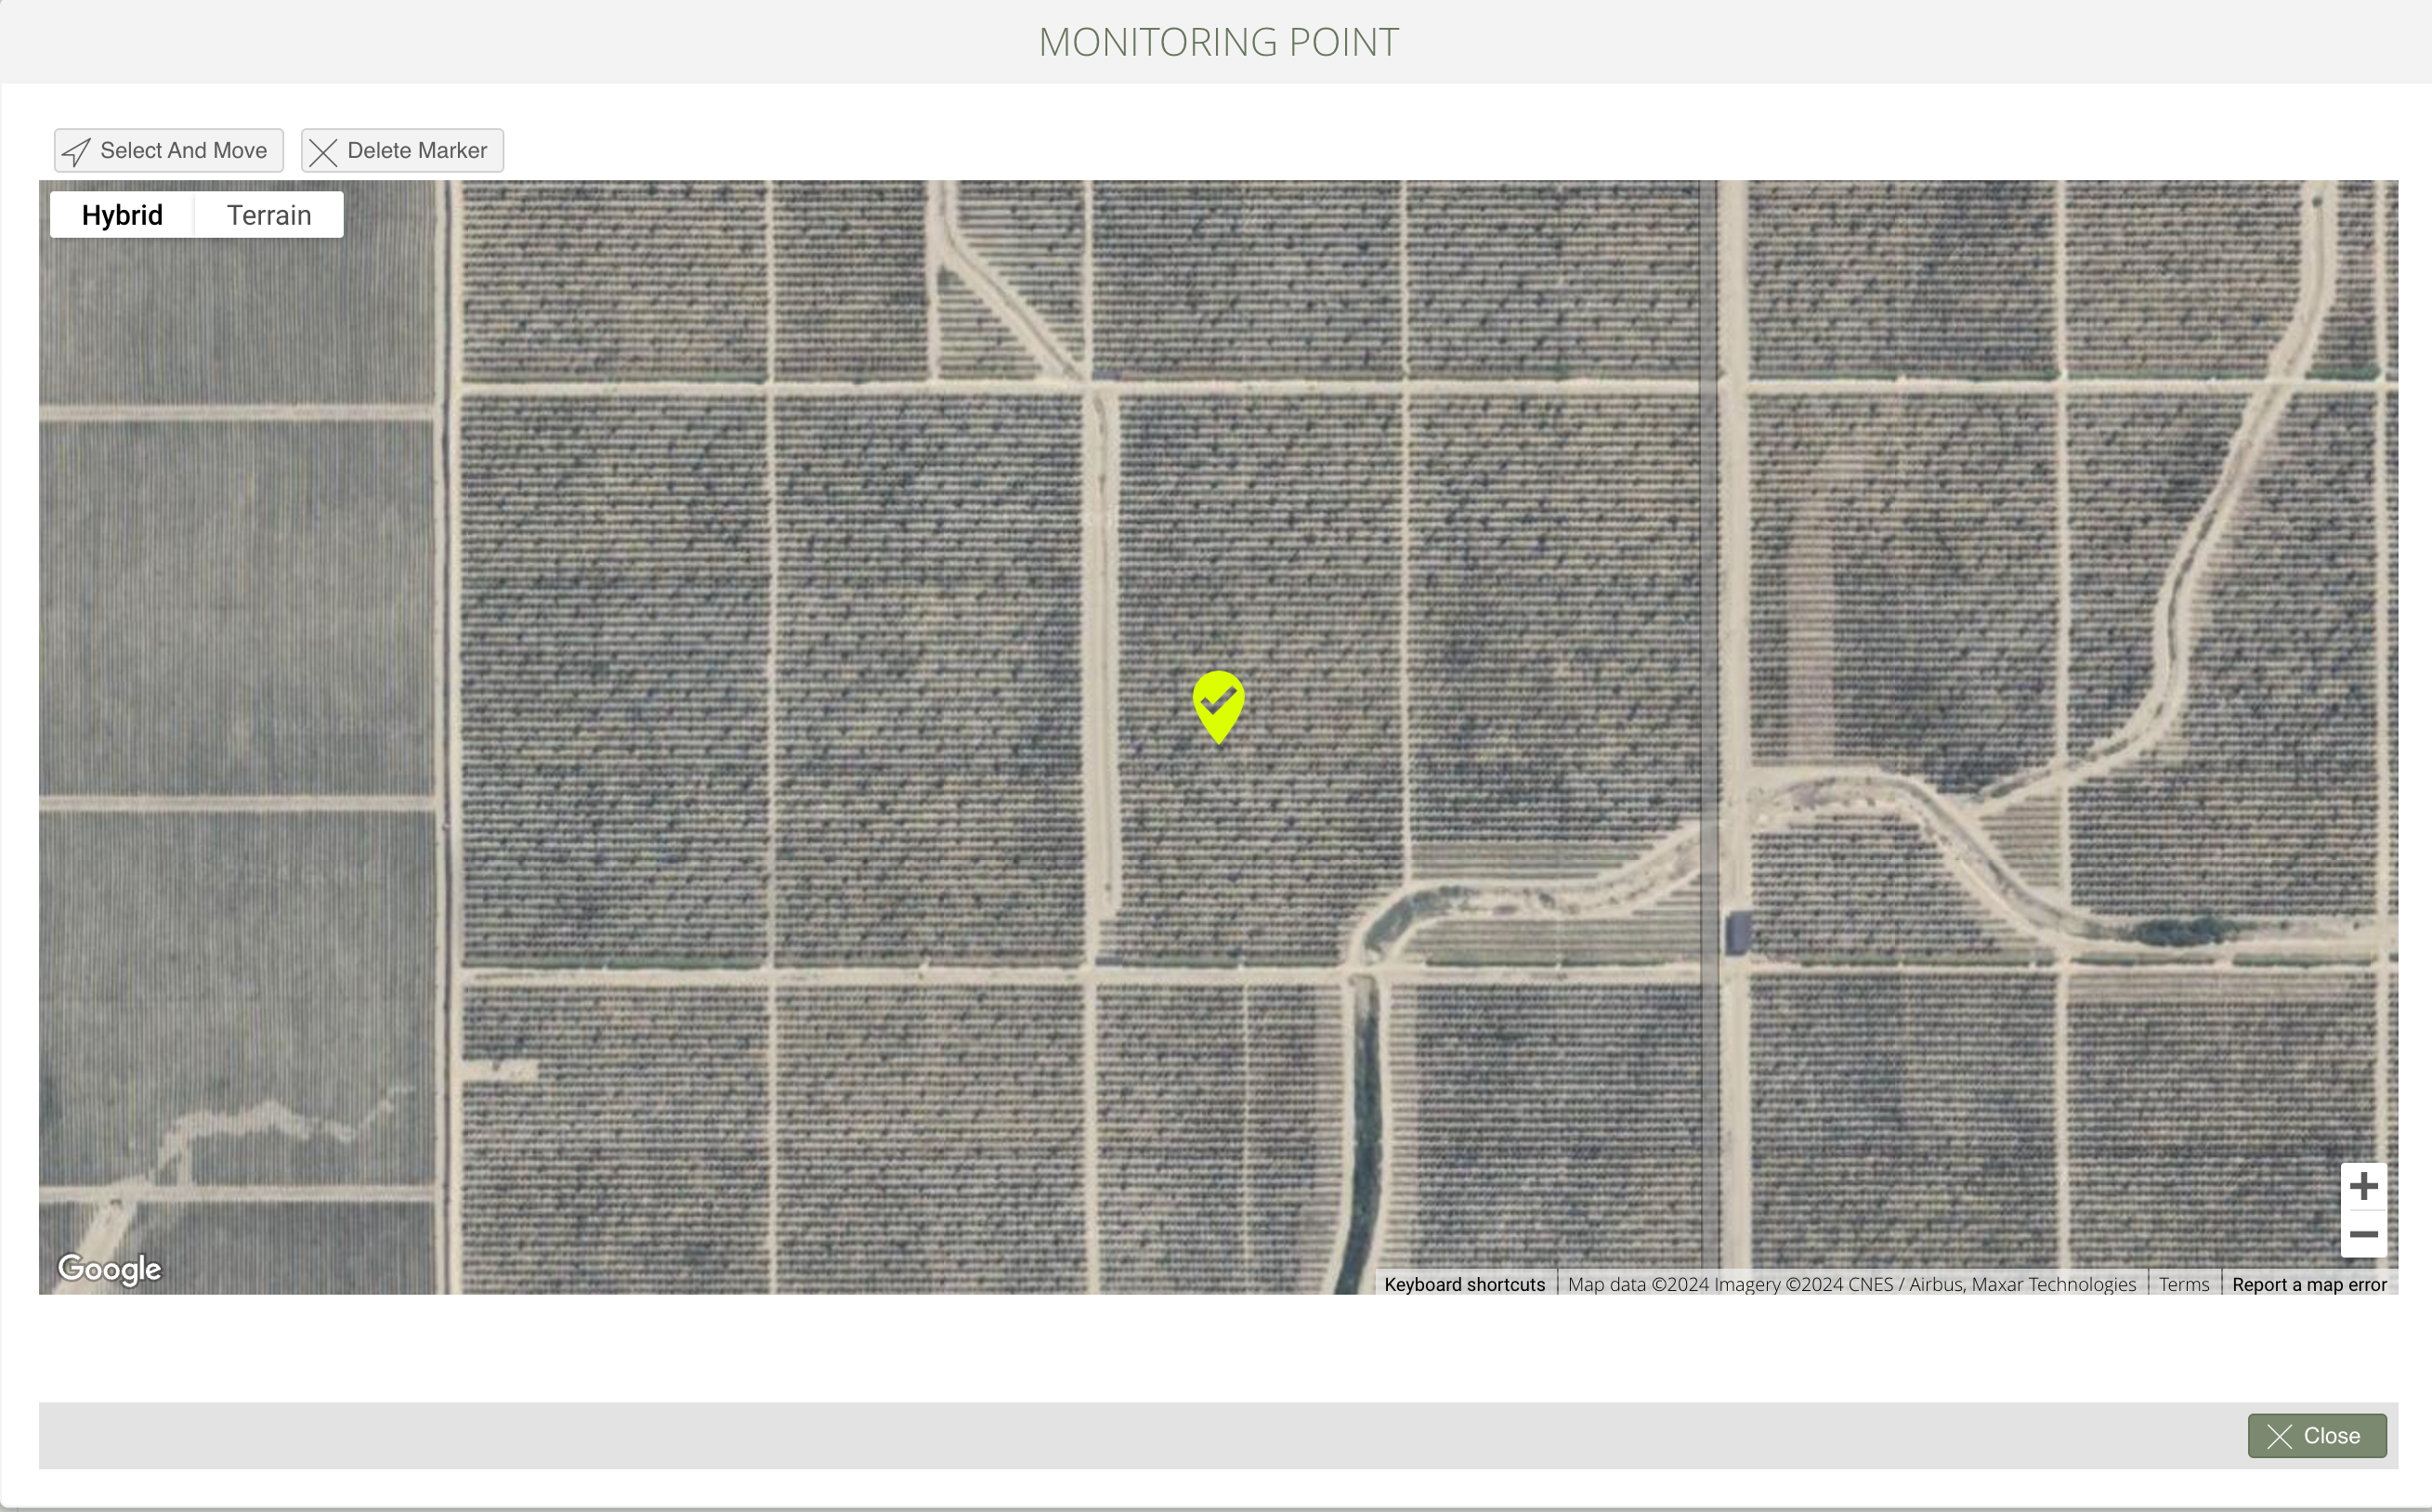
View all your Monitoring Point locations on a map. If the logger doesn’t provide you with its location you can manually add a marker to show the position of the monitoring points.
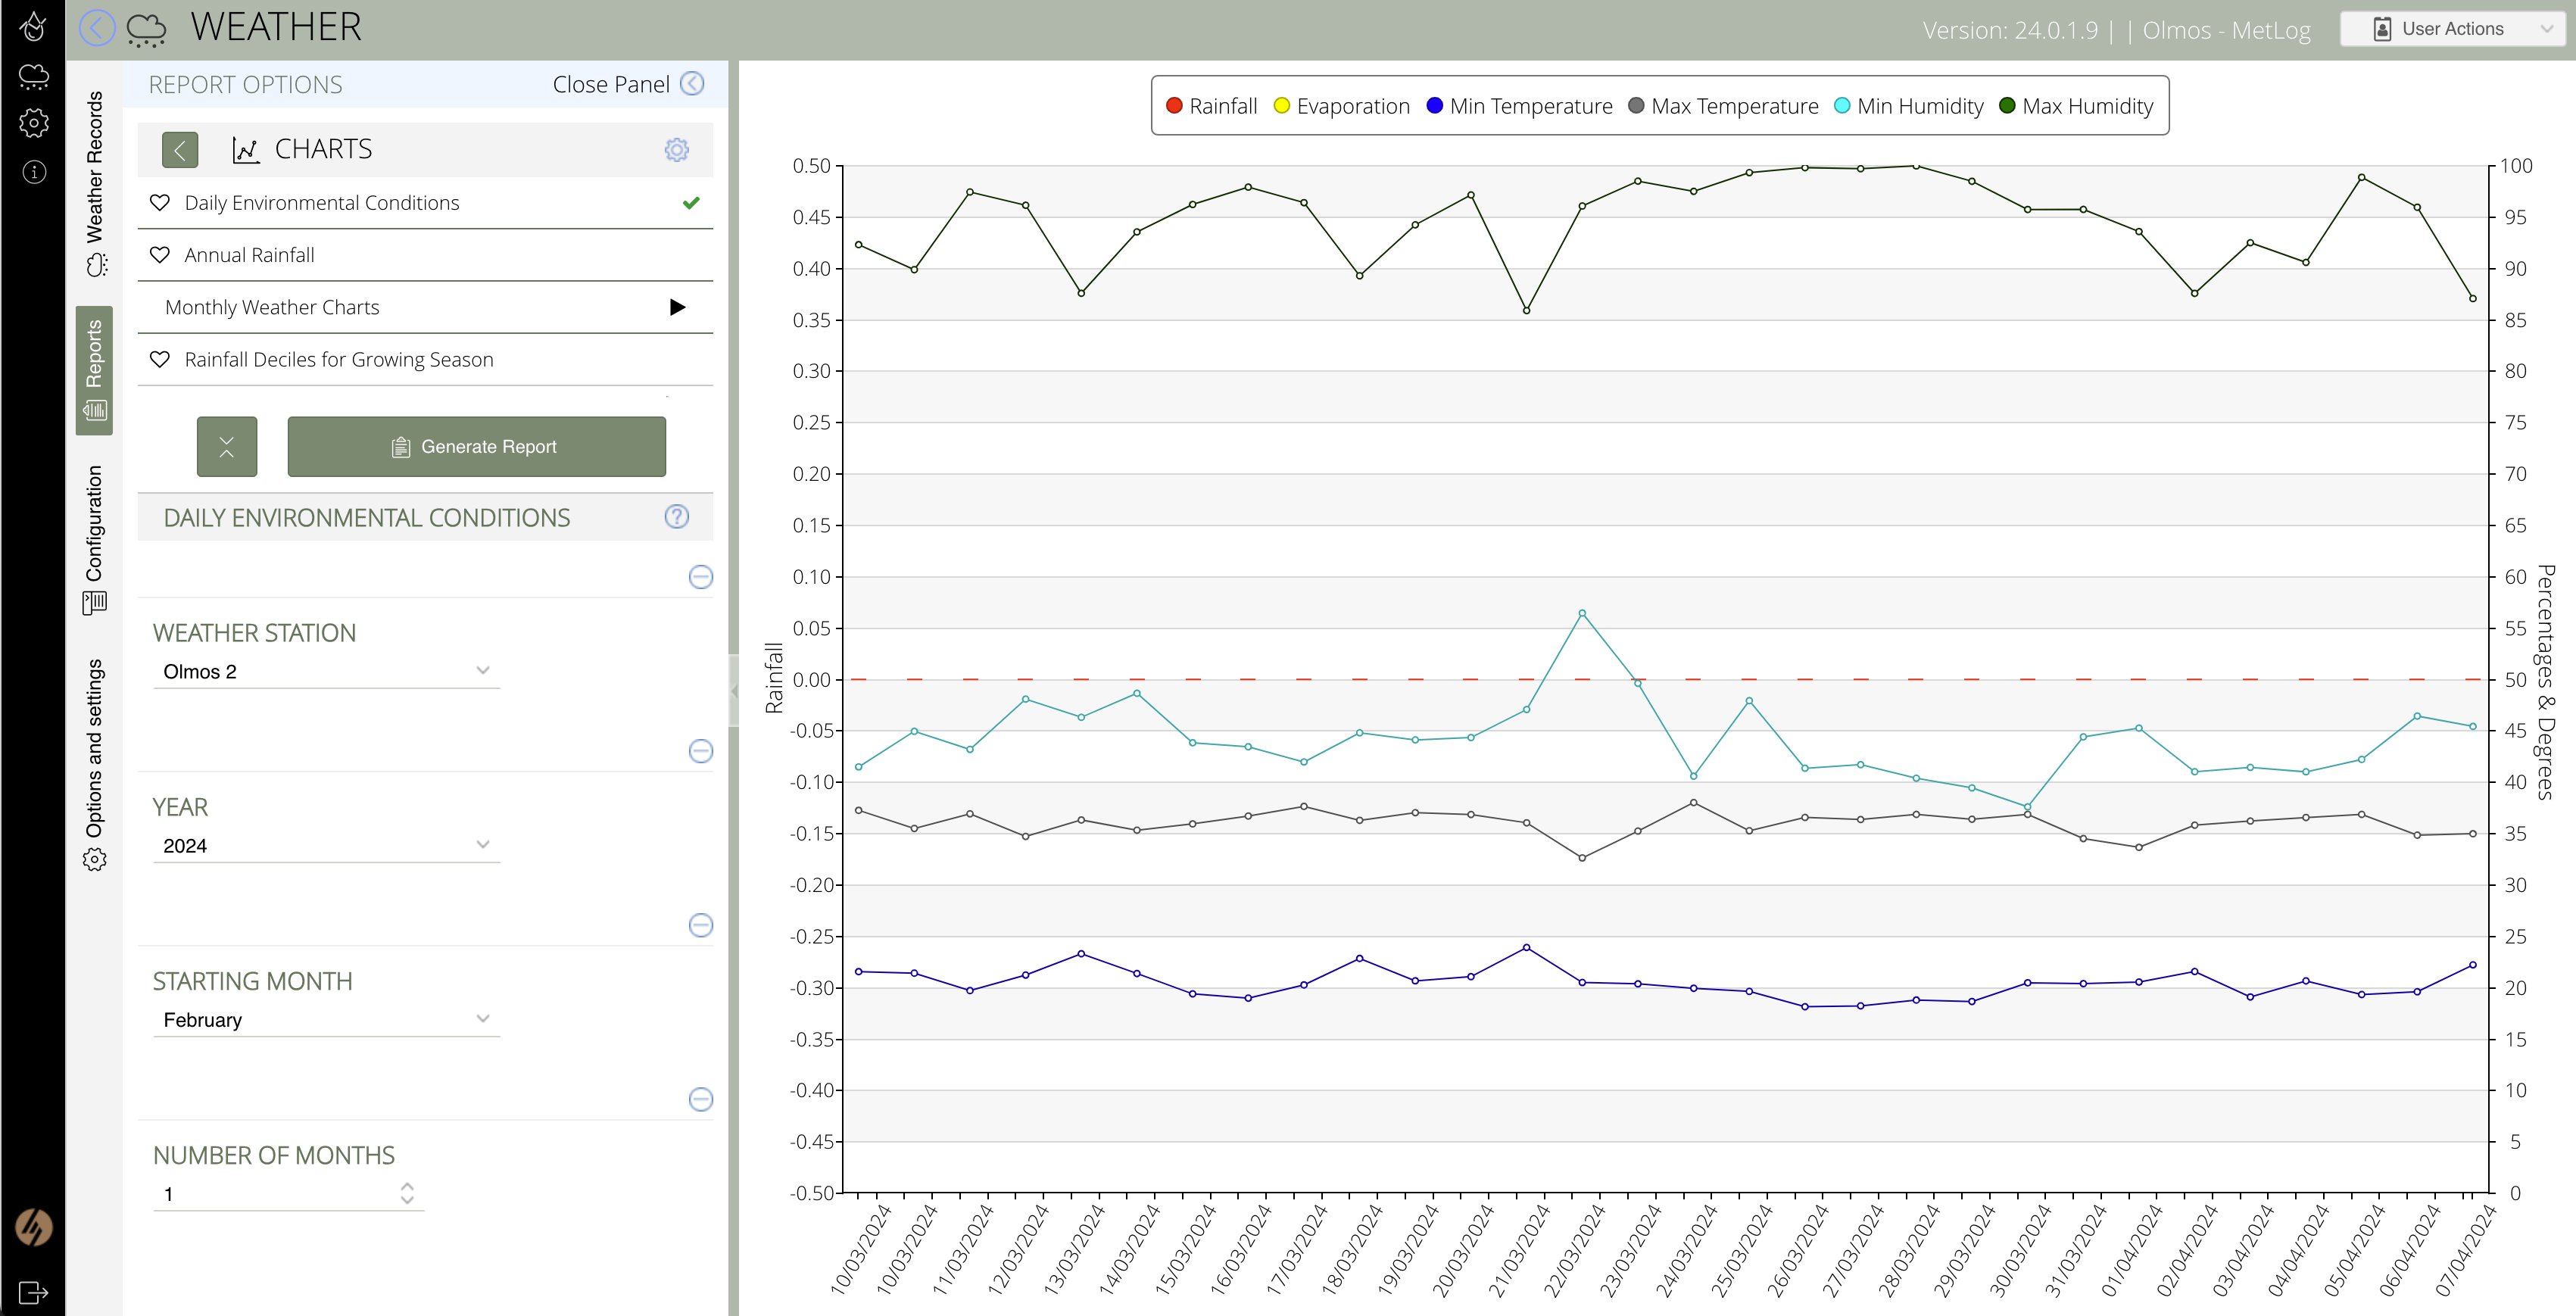
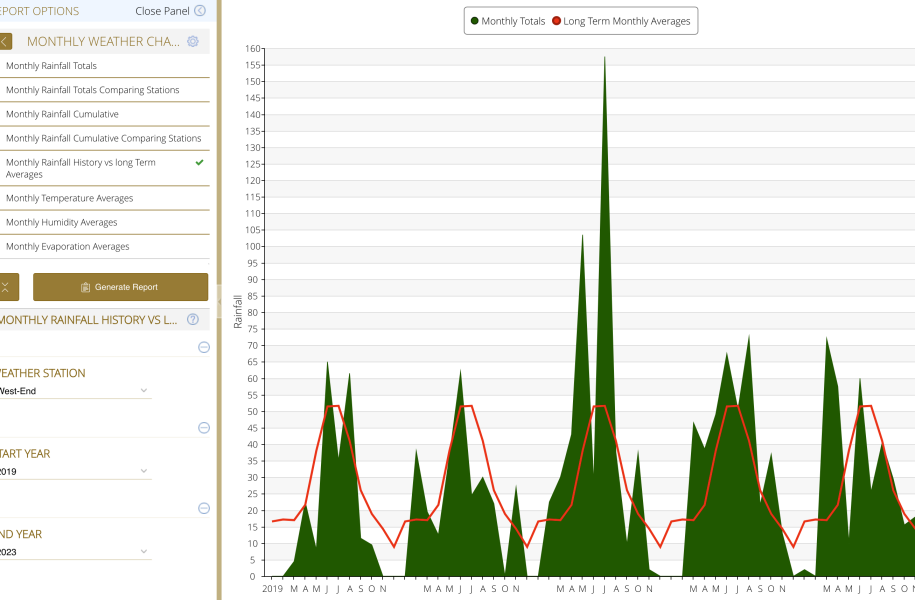
Below is a screenshot of one of the charts available in the Daily Weather Records module.
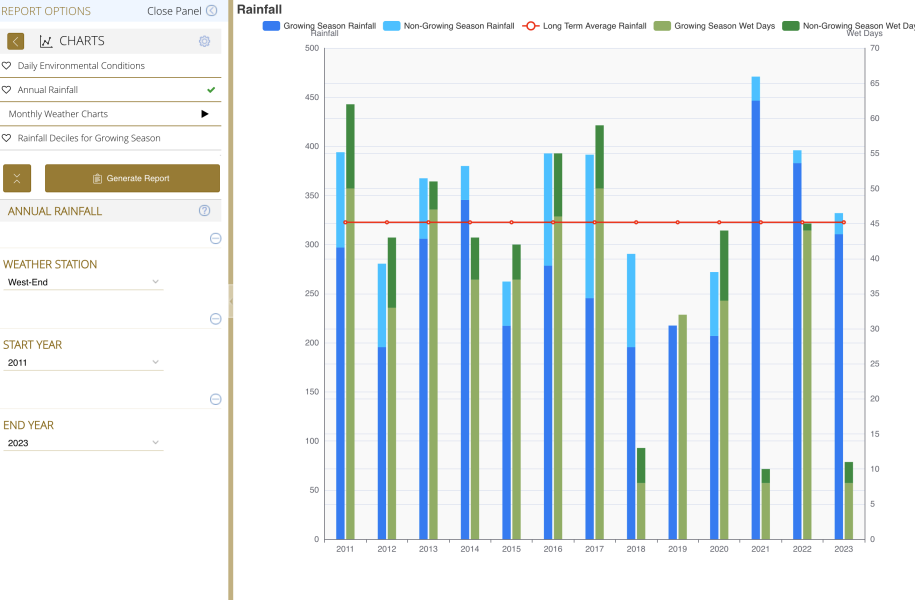
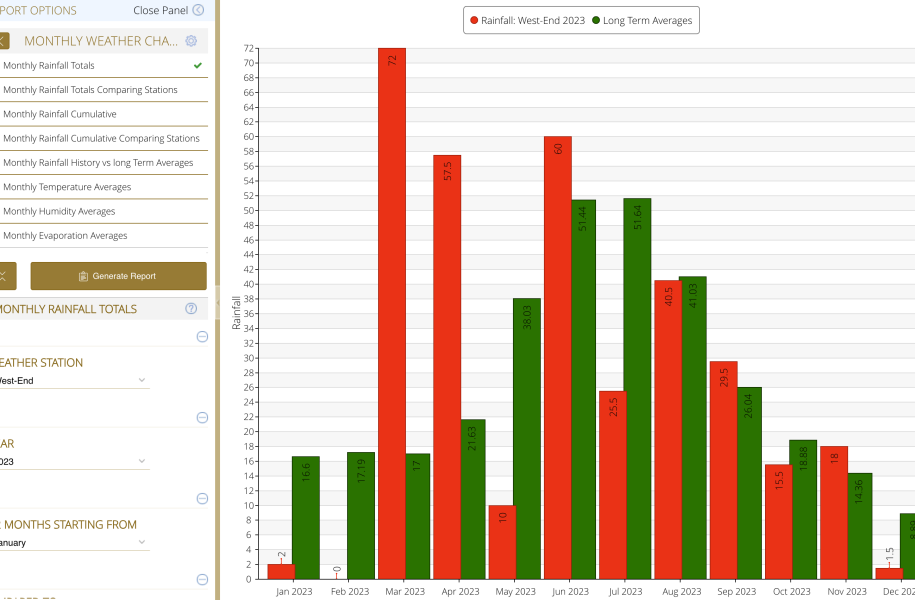
Some more examples of the charts you will be able to generate from your Daily Weather Records

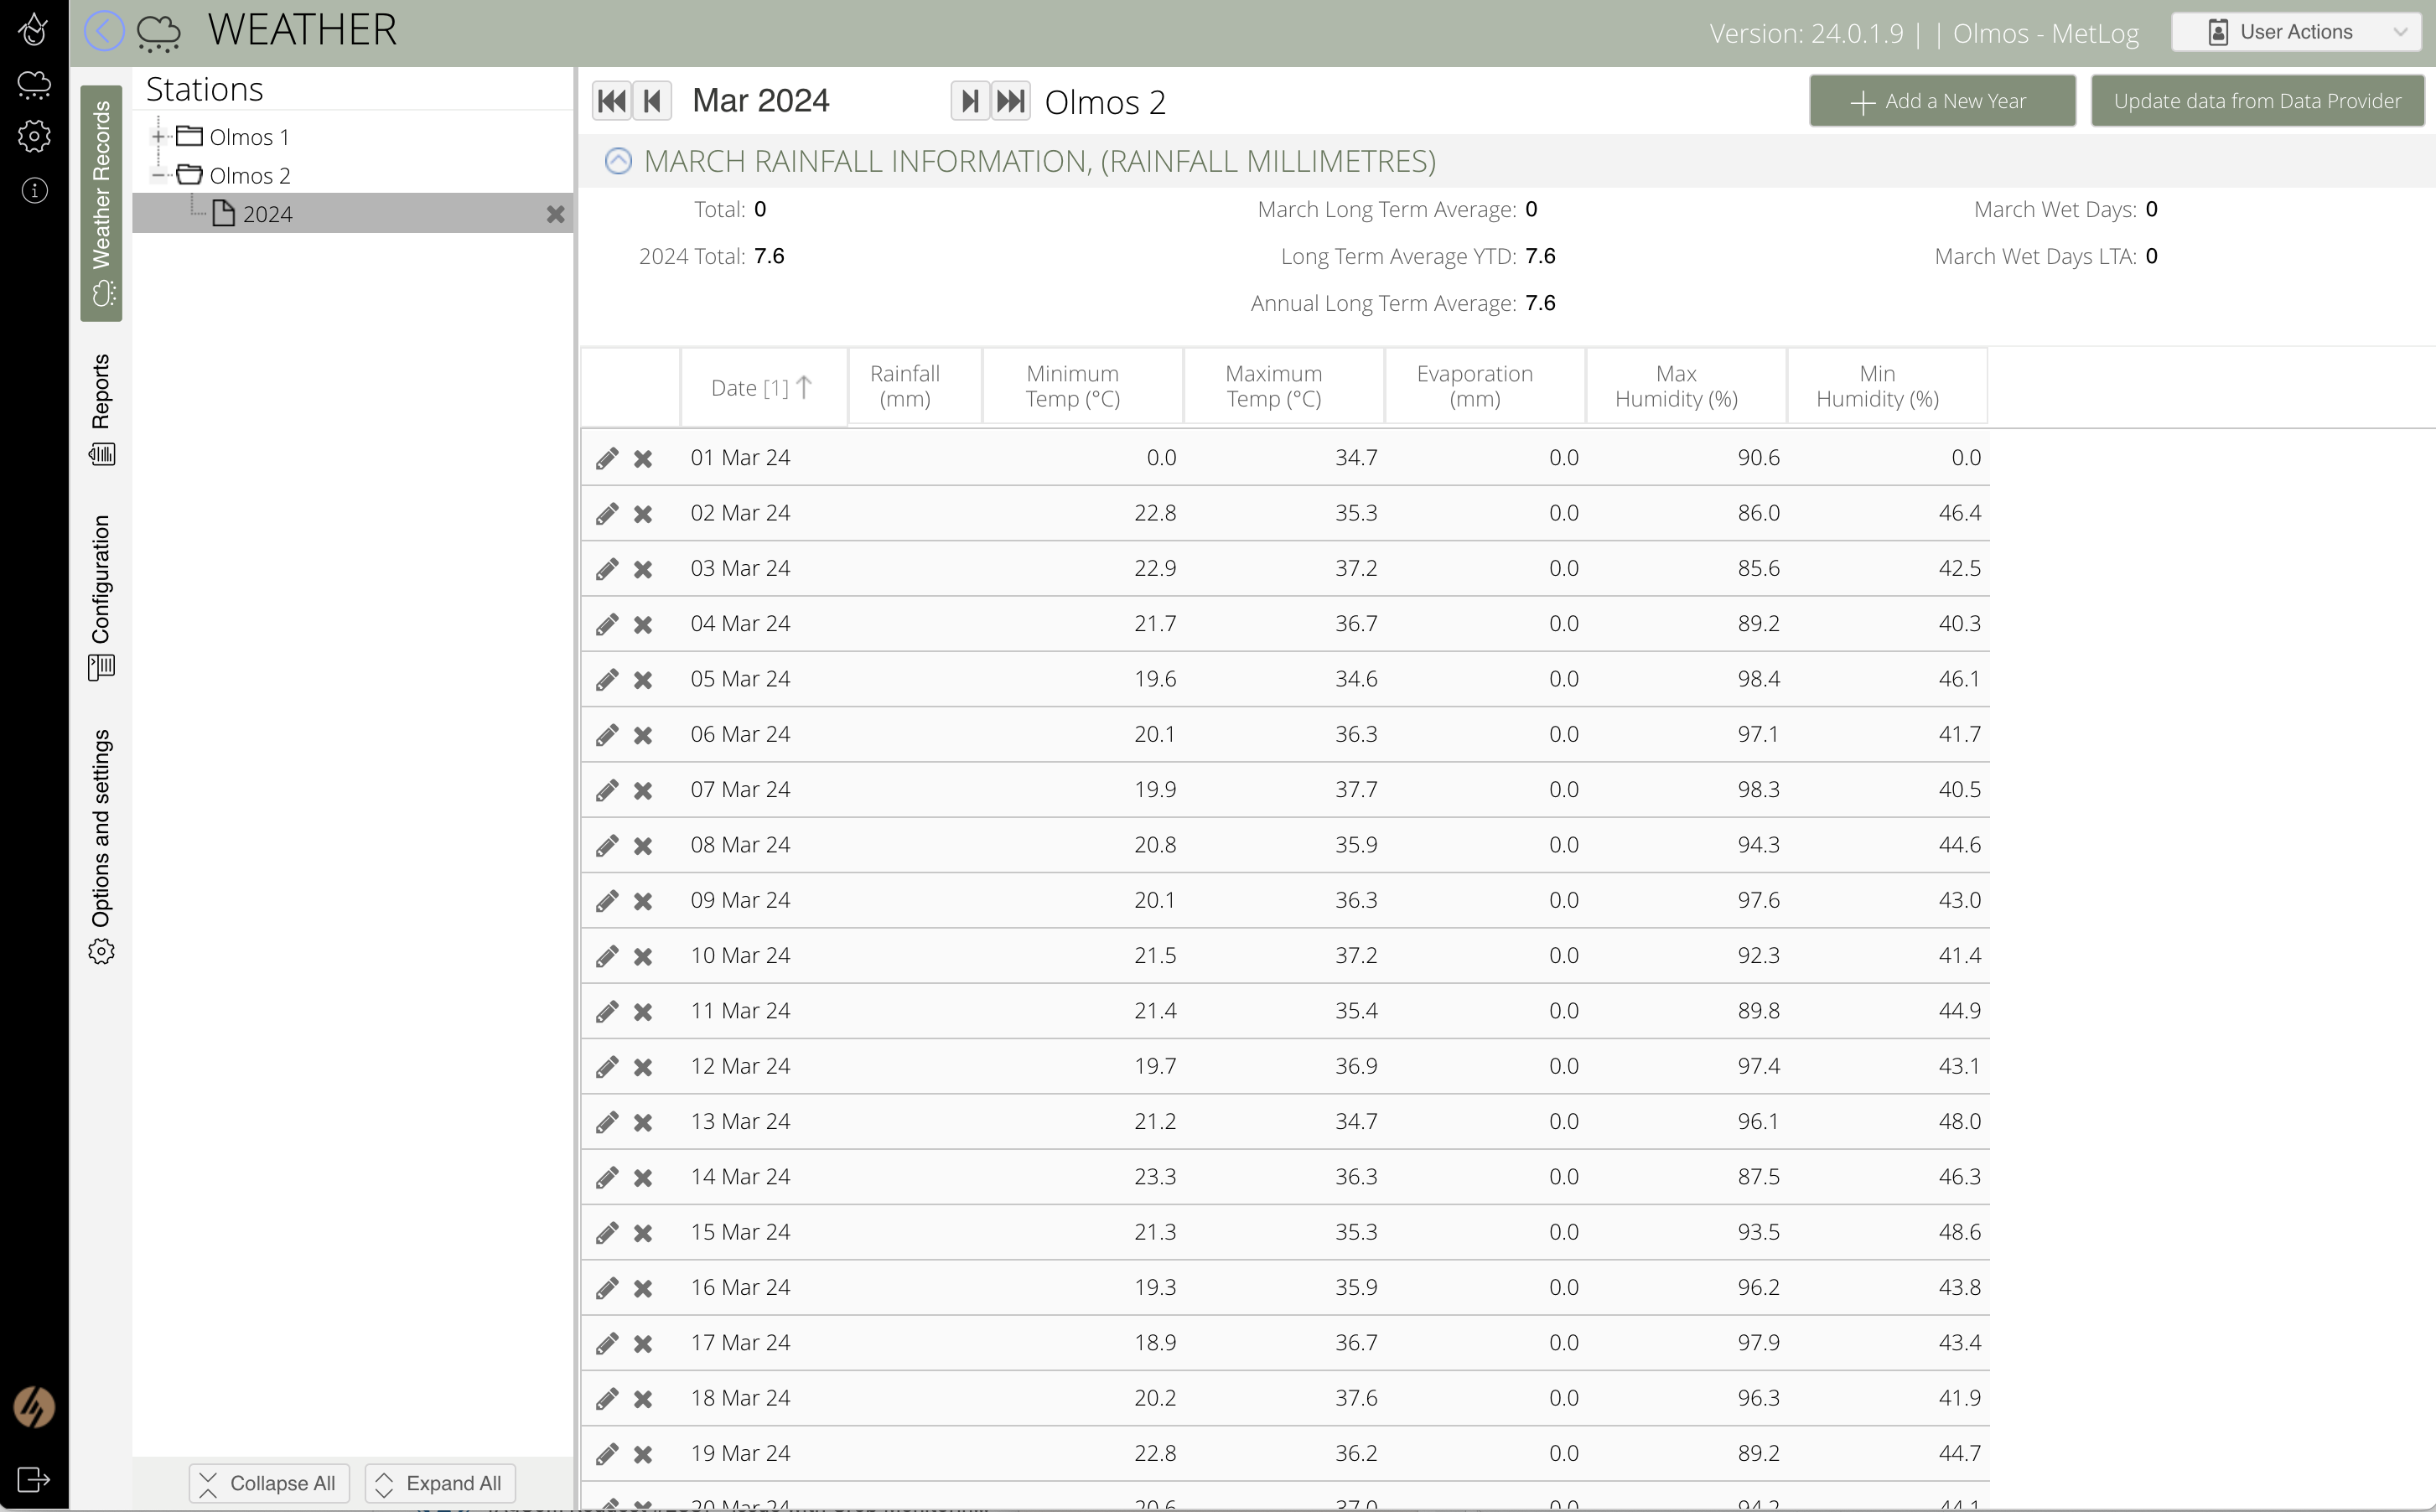
Daily Weather data can either be manually entered or downloaded from a weather station.
The daily minimum and maximum temperatures and humidities and are stored as are daily rainfall and evaporation totals (if available).
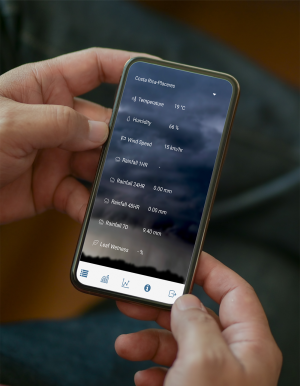

In both Metric & Imperial.
Users can choose their Language.
PLEASE CONTACT US FOR PRICING & MORE INFORMATION

This website uses cookies to improve your experience. We will assume you are ok with this, but you can opt-out if you wish. Read More
| Name | Domain | Purpose | Expiry | Type |
|---|---|---|---|---|
| wpl_user_preference | www.agcommander.com | GDPR Cookie Consent Preferences | 1 year | HTTP |
| YSC | youtube.com | YouTube session cookie. | 52 years | HTTP |
| Name | Domain | Purpose | Expiry | Type |
|---|---|---|---|---|
| _gat_gtag_UA_178432246_1 | agcommander.com | Google Ads Tracking | Session | --- |
| VISITOR_INFO1_LIVE | youtube.com | YouTube cookie. | 6 months | HTTP |
| Name | Domain | Purpose | Expiry | Type |
|---|---|---|---|---|
| _ga | agcommander.com | Google Universal Analytics long-time unique user tracking identifier. | 2 years | HTTP |
| _gid | agcommander.com | Google Universal Analytics short-time unique user tracking identifier. | 1 days | HTTP |